PDIndexer is a free, open-source application for analyzing one-dimensional powder diffraction patterns from laboratory / synchrotron X-rays and neutron time-of-flight (TOF) measurements. In a single window you can display measured profiles, overlay diffraction lines calculated from crystal structures, refine lattice constants by fitting peaks, and estimate pressure from the equations of state of standard materials. It is a help for researchers in high-pressure science, powder X-ray diffraction, and synchrotron / neutron crystallography.
Download & install
Get it from the latest release on GitHub.
- Normally, download and run PDIndexerSetup.msi to install. On first launch you may be prompted to install the .NET Desktop Runtime 10.
- If you cannot run the MSI, extract PDIndexer-…-portable.zip and run PDIndexer.exe.
- If SmartScreen warns, choose “More info” → “Run anyway”.
What you can do
- Display and compare profiles
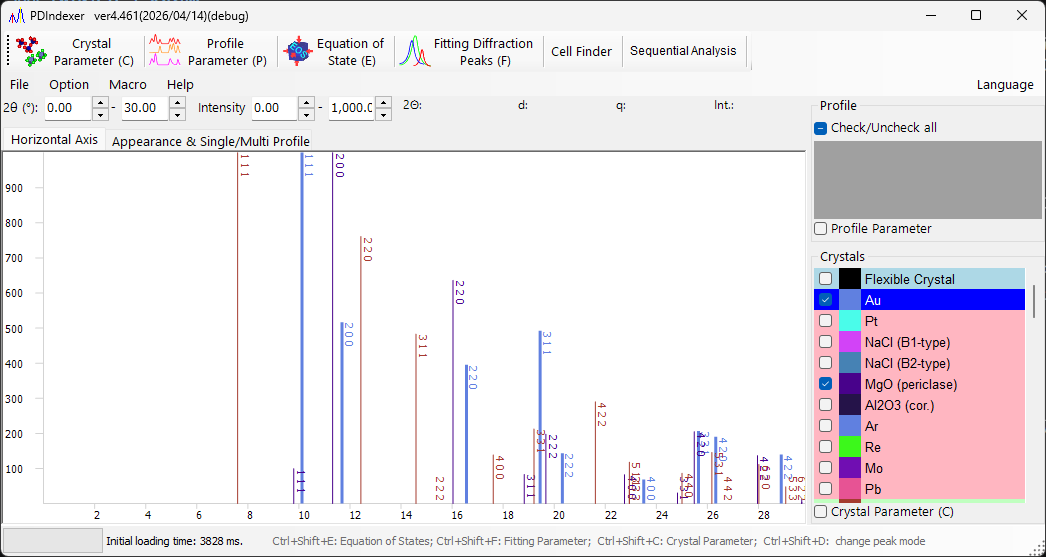
You can overlay several one-dimensional diffraction profiles in a single window. The horizontal axis switches between 2θ, d-spacing and q, and many file formats are supported (csv, ras, nxs, chi and more). - Identify phases
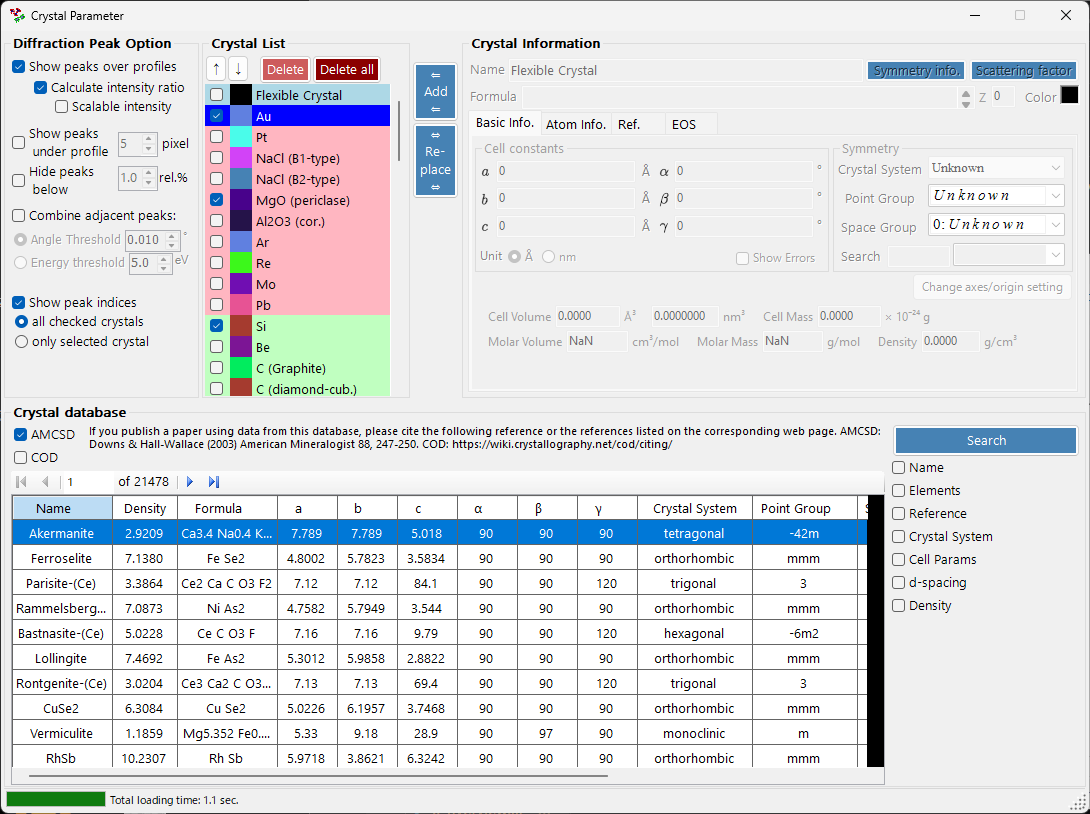
The diffraction lines (positions and relative intensities) of known crystals are calculated and overlaid on the measured profile so you can identify phases. You can use the built-in crystal database or CIF / AMCSD files. - Fit peaks and refine the lattice
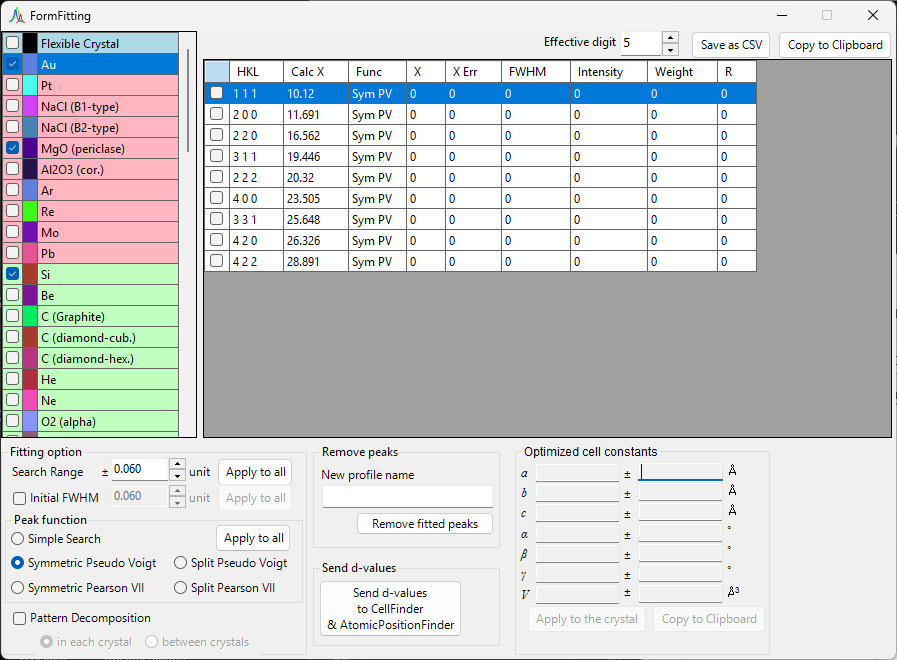
Diffraction peaks are fitted with pseudo-Voigt functions, and lattice constants are refined from the peak positions by least squares. The Cell Finder searches for candidate lattice constants. - Estimate pressure from equations of state
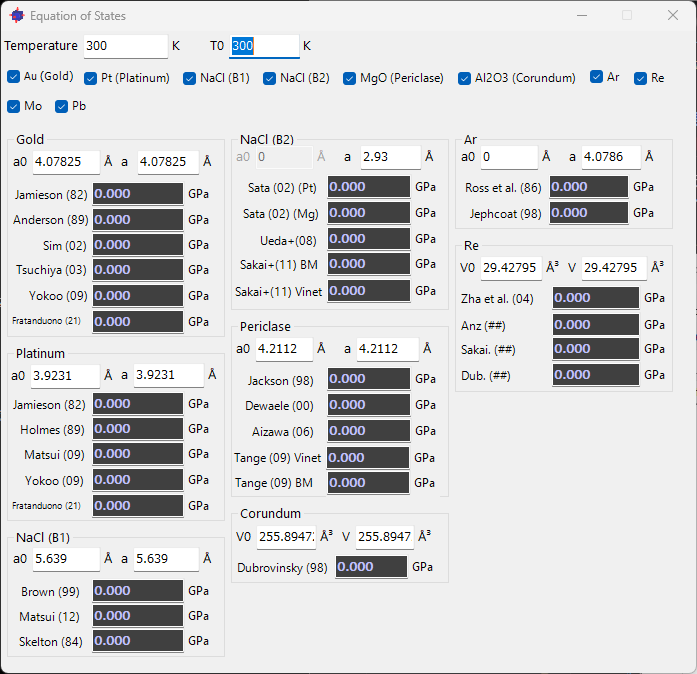
From the cell volume of a standard material (NaCl, Au, Pt, MgO and others), pressure and temperature are estimated using built-in equations of state. This is useful for in-situ high-pressure experiments with a diamond anvil cell or multi-anvil press. - Sequential analysis
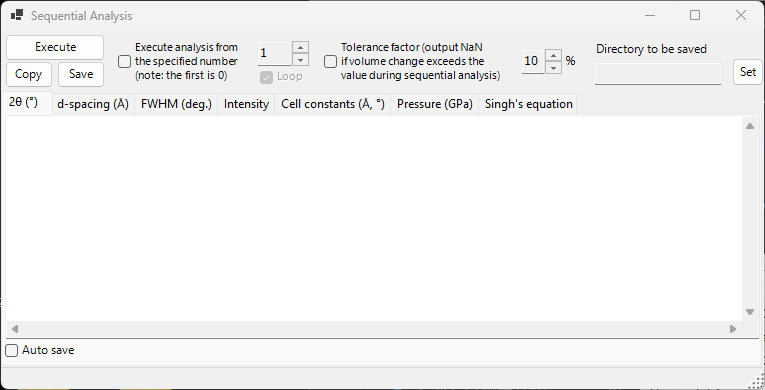
A series of profiles measured in succession can be processed together to track changes in lattice constants, FWHM, intensity and pressure. The results can be exported as CSV. - Automate with macros
Python-syntax (IronPython) macros let you automate repetitive work, from loading to analysis and output.
A typical workflow
- Load a profile (many formats are supported; you can also receive one from the sister app IPAnalyzer via the clipboard).
- Overlay known crystals to identify phases, and fit the peaks.
- Refine lattice constants or estimate pressure, and run sequential analysis on a series to export CSV.
Key features
Crystal parameters and diffraction lines
It calculates the line positions and relative intensities of known crystals and overlays them on the measured profile for phase identification. CIF / AMCSD import and export are supported.
Peak fitting and lattice refinement
It fits the position, full width at half maximum and intensity of diffraction peaks with pseudo-Voigt functions, and refines lattice constants by least squares.
Equation of state (pressure)
It estimates pressure and temperature from the cell volume of a standard material using built-in equations of state — handy for in-situ high-pressure diffraction.
Sequential analysis
It tracks changes in lattice constants, pressure and intensity across a series of profiles, and writes them out as CSV.
Works with IPAnalyzer
Paired with IPAnalyzer, which converts two-dimensional diffraction images into one-dimensional profiles, you can go from image acquisition to phase identification and lattice refinement in one flow. Profiles are passed directly via the clipboard.
Who it’s for
PDIndexer has been used since 2005 by researchers working in high-pressure science, powder X-ray diffraction, and synchrotron / neutron crystallography.
Learn how to use it
Window-by-window guides, analysis examples and the macro function reference are collected in the online manual.