1.0. Overview
When IPAnalyzer starts successfully, the following window is displayed. From this window, you can load images, apply masking and other processing to the measured diffraction patterns to calculate one-dimensional profiles, and optimize the geometric parameters of the detector using standard material diffraction patterns.
This window is broadly divided into the following sections:
- File menu (top)
- Action menu (upper area)
- Image display area (center)
- Image information display/settings (left)
- Tool list (right)
- Statistical information (bottom)
The details of each section are described below.
1.1. Image Display Area
Please adjust the loaded image for better visibility using the color scale and contrast settings described later. In addition to the brightness inherent to the image itself, the following semi-transparent filters are overlaid:
1.1.1. Filter Colors
- Light blue: Pixels masked manually or automatically
- Green: Edge pixels excluded from integration
- Purple: Area outside the integration range
- Blue: Pixels below the threshold intensity
- Red: Pixels above the threshold intensity
These can be configured from \”Image Range Settings\” or \”1D Integration Conditions\” in the Property window described later.
1.1.2. Mouse Operations
Normal Mode
- Left drag: Scrolls the image.
- Left double-click: Zooms in (centered at the clicked position).
- Right double-click: Zooms out.
- Wheel: Zooms in/out.
- CTRL + right drag: Selects a yellow rectangular area and displays its statistical information in the \”Statistical info.\” area below.
Manual Spot Mode
- Left click: Masks the selected area.
- Right click: Removes the mask from the selected area.
1.1.3. Mouse Position Information / Magnification Settings
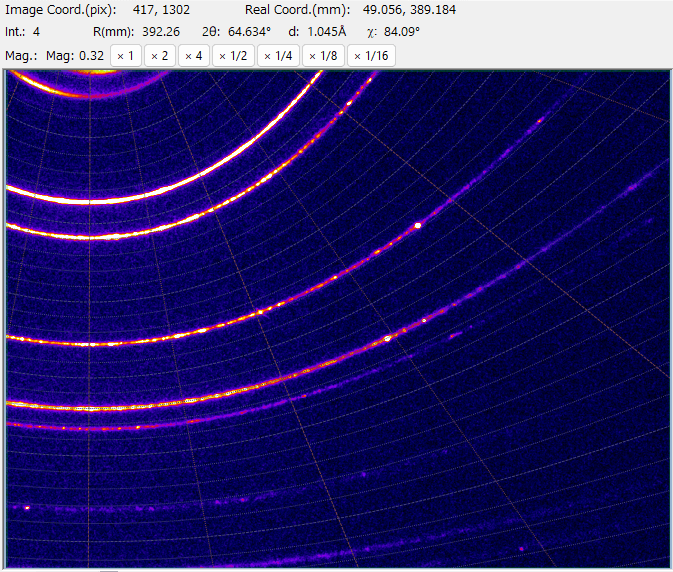
Information about the mouse position and magnification setting buttons are displayed at the top of the image display area.
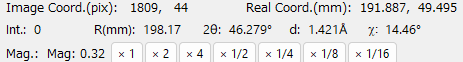
- Image Coord. (pix): Pixel coordinates with the origin at the upper-left corner of the image
- Detector Coord. (mm): Coordinates in millimeters with the origin at the direct beam position
- 2θ, d, Q: 2θ value, d-spacing, and Q value corresponding to the pixel position. Requires correct detector parameters.
- Intensity: Intensity value of the pixel
- Magnification buttons (Fit/In/Out/100%): Buttons to adjust the magnification of the image display
1.2. Image Display Settings
1.2.1. Display Format
Select the image display format from the combo box displayed to the left of the image area.
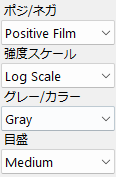
Positive/Negative
Sets whether to display the brightness as Positive or Negative.
Intensity
Sets whether to display the intensity in Linear or Log (logarithmic) scale.
Gray/Color
Sets whether to display the image in grayscale or color scale.
Scale
Sets the color scale for display.
1.2.2. Contrast
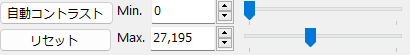
Min. / Max.
Sets the minimum/maximum values of the displayed brightness (displayed value). You can either enter values directly or move the slider. Values cannot be set beyond the minimum/maximum values of the loaded image.
Auto Contrast
Automatically sets the minimum/maximum values of the displayed brightness based on the mean and standard deviation of the brightness in the image.
Reset
Resets the minimum/maximum values of the displayed brightness.
1.3. Sub-Image Area / Image Information

1.3.1. Sub-Image Area
This area is used to display the unrolled (cake) image.
1.3.2. Image Information
Displays the file name, resolution (pixels), and other basic information of the loaded image.
1.4. Bottom Area
1.4.1. Frequency of intensity
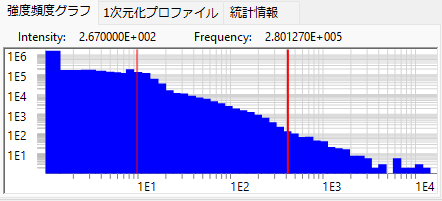
Displays a frequency histogram of the brightness in the image. Both the vertical and horizontal axes are logarithmic. The two red lines indicate the minimum/maximum values of the displayed brightness. They can also be dragged with the mouse.
1.4.2. Converted profile
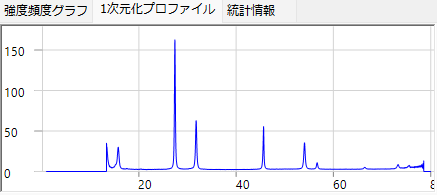
Displays the one-dimensional profile calculated from the two-dimensional image by integration. The horizontal axis is the 2θ angle. This profile is updated when the \”Get profile\” icon is clicked.
1.4.3. Statistical info.
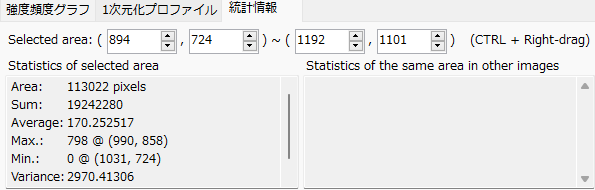
When you CTRL + right-drag in the image display area, a yellow region is set. This tab displays statistical information about the yellow selected region.
1.5. File Menu
1.5.1. File
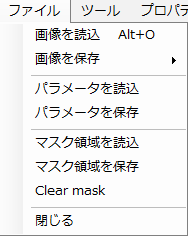
Load image
Loads an image. Supported formats include TIFF, IPA, and other common image formats. You can also drag and drop an image file onto the main window to load it.
Save image
- As TIFF: Saves the image in TIFF format.
- As PNG: Saves the image in PNG format.
- As IPA: Saves the image in IPA format. This option corrects image distortion and generates a perfectly square pixel image. It also writes information such as wavelength and camera length.
Load/Save parameters
Loads/saves parameters such as wavelength and film distance. The file extension is \”prm\”.
Load/Save mask region
Loads/saves the integration exclusion region (mask region). Mask files (*.mas) can only be loaded if they have the same resolution as the currently displayed image.
Clear mask
Clears the current integration exclusion region (mask region).
Close
Exits the application.
1.5.2. Tools
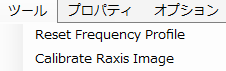
Reset Frequency Profile
Not implemented yet.
Calibrate RAxis image
Not implemented yet.
1.5.3. Property
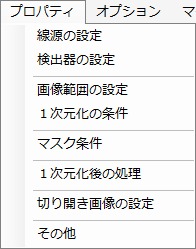
Configures various property settings. For details, please refer to 2. Property.
1.5.4. Options
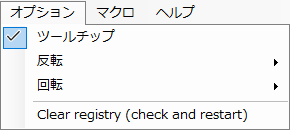
Tooltips
Enables/disables tooltips display.
Flip/Rotate
Flips or rotates the image vertically/horizontally. Some detectors may output images that are flipped or rotated. In such cases, use this option to correct the image orientation.
Clear registry
Clears the registry. If the software is behaving abnormally, try this option. A restart is required.
1.5.5. Macro
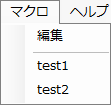
Opens the window for editing macros. If macros are already registered, their names are displayed, and clicking on one executes that macro. For details about macros, please refer to 5. Macro.
1.5.6. Help
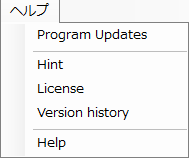
Update
Checks whether a new version has been released, and performs an update if available.
Version history
Displays the version history.
Hint
Deprecated.
Help
Displays this page.
1.5.7. Language
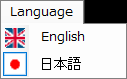
Switches the display language. The change takes effect after restarting.
1.6. Action Menu
1.6.1. Background
Not implemented yet.
1.6.2. Center Position

Clicking the icon performs a 2D pseudo-Voigt function fitting within the search range (default: 8 pixels) from the current direct spot position. Pressing the ▽ button to the right of the icon opens the settings screen for center position search.
1.6.3. Mask
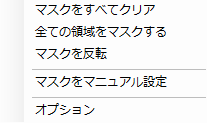
Clear all masks / Mask all regions
Removes all masks, or masks all regions.
Invert mask
Inverts the mask.
Options
Opens the property screen for mask conditions. When you click the icon, the operation performed depends on the selected mode: in \”Spot\” mode, automatic spot detection and masking is performed; in \”Manual\” mode, you can specify mask regions by drawing on the image. The size of the mask brush is specified by \”Spot radius\”.
1.6.4. Get profile

Clicking the \”Get profile\” icon calculates a one-dimensional profile from the loaded image. The subsequent behavior can be configured in the \”Post-integration processing\” section of the Property settings. Pressing the ▽ button to the right of the icon shows the following submenu.
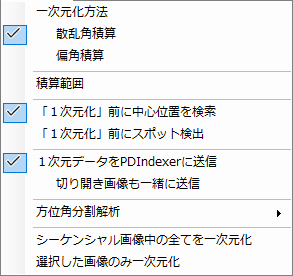
When checked, the center position search or spot detection is automatically executed before the 1D integration.
Send 1D data to PDIndexer
When PDIndexer is running simultaneously, the 1D data is sent to PDIndexer via the clipboard. The unrolled image can also be sent together (note that the data size becomes very large).
Azimuthal angle sectoring analysis
Performs azimuthal angle sectoring analysis for orientation and stress evaluation. When this menu is checked and the \”Get profile\” icon is clicked, the image is divided in the azimuthal (polar angle) direction, and each sector is independently converted to a 1D profile. The data is then saved or sent to PDIndexer according to the \”Post-integration processing\” settings in the Property.
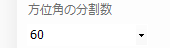
When checking the azimuthal angle sectoring analysis, a setting dialog appears. Set the start angle, end angle, and step angle. The angle is measured counterclockwise from the 3 o’clock direction. You can also set the entire 360-degree range.
1.7. Tool List
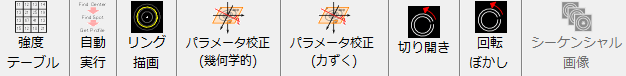
1.7.1. Intensity Table
To be deprecated.
1.7.2. Auto-Run
Provides functions to monitor a specific directory and automatically load files, and to automatically perform processing such as 1D integration after loading. This is explained in detail on a separate page.
1.7.3. Ring Drawing
This is explained in detail on a separate page.
1.7.4. Parameter Calibration (Geometric)
Optimizes the wavelength of the incident beam and the geometric configuration of the detector from the diffraction pattern of a standard material using geometric calculations. For details, please refer to 3. Parameter Calibration (Geometric).
1.7.5. Parameter Calibration (Brute-force)
Optimizes the wavelength of the incident beam and the geometric configuration of the detector from the diffraction pattern of a standard material using brute-force calculation. For details, please refer to 4. Parameter Calibration (Brute-force).