3.0. Overview
The Crystal Structure Viewer (Structure viewer) draws the structure of a crystal selected in the main window in three dimensions. Since it uses rendering with OpenGL 1.3, a compatible video card is required. The rotation state of the crystal is synchronized across all windows, and when you rotate the crystal in one window, that state is immediately reflected in the other windows.
The Crystal Structure Viewer is broadly divided into the following parts.
- Main Area (OpenGL drawing area in the center of the screen)
- File Menu (top of the screen)
- Tab Menu (bottom of the screen)
- Bottom Toolbar (bottom of the screen)
For details on each, see below.
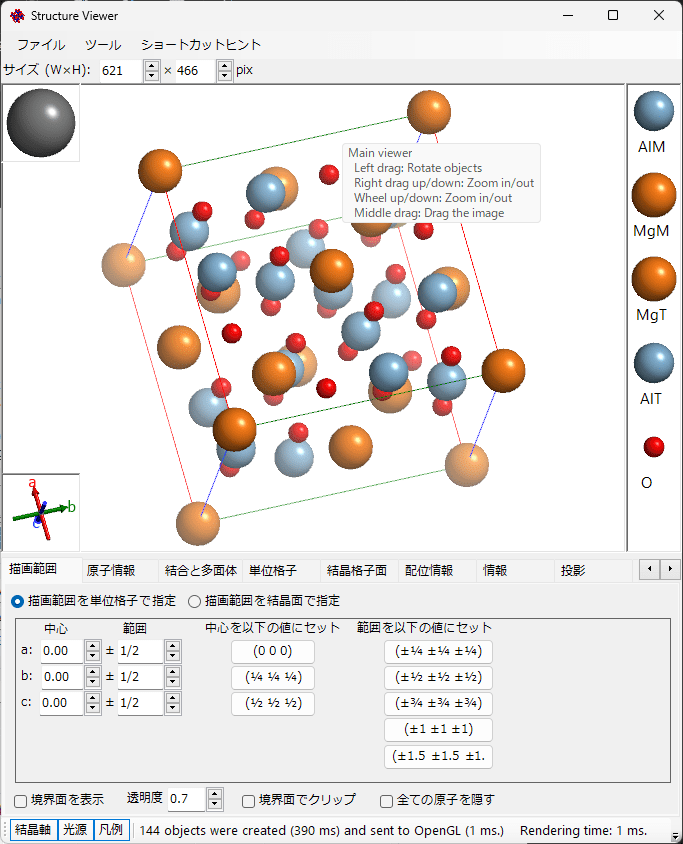
3.1. Main Area
The crystal structure is drawn in the center of the screen. The direction of lighting is drawn in the upper left. The direction of the crystal axes is displayed in the lower left. A legend of atoms is displayed on the right side.
3.1.1. Mouse Operations
The following mouse operations are accepted.
- Left button drag: Rotation
- Middle button drag: Translation
- Right button drag (up/down) or mouse wheel: Zoom in/out
- Left double-click: Display detailed atom information
- Control + right double-click: Change perspective <-> orthogonal projection.
- Control + right drag (up/down): Change degree of perspective.
3.2. File Menu
3.2.1 File
Save Image
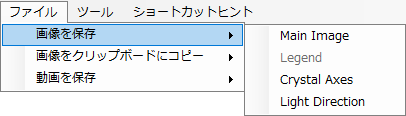
Save the drawn image to a file. Select either the main image, legend, crystal axes, or light source direction, and specify a filename to save.
Copy Image to Clipboard
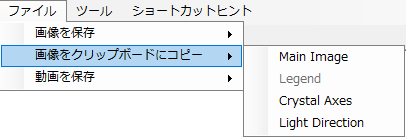
Copy the drawn image to the clipboard. Select either the main image, legend, crystal axes, or light source direction, and paste it into an appropriate application. The shortcut CTRL+SHIFT+c copies the main image.
Save Movie
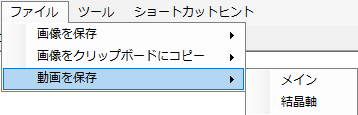
Generates a movie file by rotating the drawn image in a specified direction at an arbitrary speed.
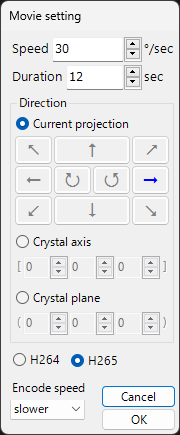
First, select either the main image or the crystal axes, and the Movie settings window will appear. In the Movie settings window, configure what kind of movie you want to create.
Speed
Set the rotation speed.
Duration
Set the duration of the movie. Speed × Duration = Total rotation angle.
Direction
Current projection: Rotates the crystal around the rotation axis based on the current projection direction. Select one arrow in the direction you want to rotate.
Crystal Axis/Plane: Rotates the crystal using the crystal axis or the normal direction of the plane (of the specified indices) as the rotation axis.
H264/H265
Set the encoding method. Select H264 if you want to use it in PowerPoint.
Encode Speed
Specify the encoding speed.
3.2.2 Tools
I Like Vesta
Changes the atom colors/sizes and bond settings to have the same appearance as the well-known software Vesta.
3.2.3 Shortcut Hint
Displays the Shortcut hint.
3.3. Tab Menu
3.3.1. Drawing Range
This tab specifies the drawing range of the crystal. There are two methods for specifying it: using the unit cell as a reference and using crystal planes. You can switch between them using the radio buttons at the top.
Specify Drawing Range by Unit Cell
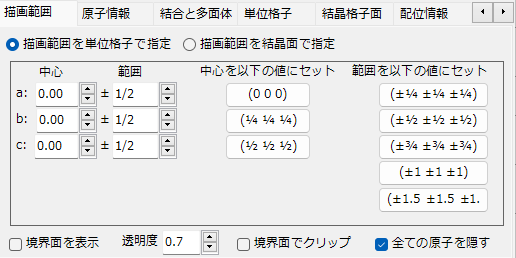
In this mode, the a, b, c axes of the unit cell are used as the unit of the drawing range. Specify the fractional coordinate of the “center” and set the upper/lower limits for each axis in the “range”.
For frequently used values, you can also specify them directly using the preset buttons on the right.
Specify Drawing Range by Crystal Planes
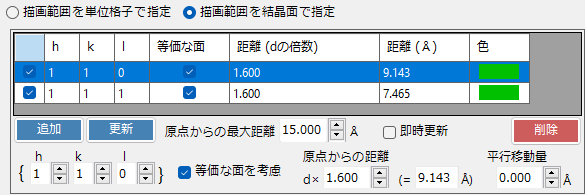
In this mode, the specified crystal planes are used as boundary planes to define the drawing range.
Boundary Plane List
A list of boundary planes is displayed. To temporarily disable a boundary plane, uncheck the checkbox at the far left of the list.
Add/Update/Delete
Click the “Add” button to add a new boundary plane, the “Update” button to replace one, and the “Delete” button to remove an existing boundary plane.
If you want to permanently save changes made here, be sure to also add or update them in the main window. Otherwise, when you change the selection in the crystal list of the main window, the changes made here will be lost.
Maximum Distance from Origin
If the entered boundary planes are incomplete and cannot define a spatially closed region, the maximum distance from the origin specified here is used to set the drawing range.
Immediate Update
When checked, changes to the settings are immediately reflected in the drawing.
h k l / Consider Equivalent Planes
Set the boundary planes using Miller indices. The “Consider equivalent planes” checkbox on the left side of the index setting section determines whether crystallographically equivalent planes to the set plane are considered1.
Distance from Origin
Set the distance from the center of the crystal to the Bound plane. The unit of distance can be selected as “d” or “Å”. In the former case, the distance is the d-value of the crystal plane multiplied by the input value (in the figure, d × 1.5 = 9.949Å). In the latter case, the input value becomes the distance as is. When one is changed, the other is automatically updated.
Translation
Specify the amount to translate the boundary plane.
Display Options
Show Boundary Planes / Opacity
Determines whether to display boundary planes. When displayed, set its transparency with Opacity (0 is transparent, 1 is opaque).
Clip by Boundary Planes
When checked, only objects within the range specified by Bounds are drawn precisely, and objects that intersect with Bounds are clipped.
Hide All Atoms
When checked, all atoms, bonds, and polyhedra are hidden2.
3.3.2. Atomic Information
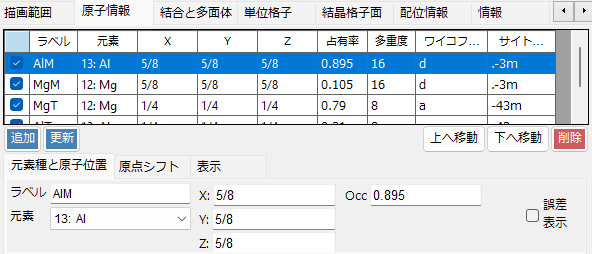
This tab sets the coordinates and appearance of atoms.
Atom List
A list of atoms contained in the crystal is displayed. To temporarily disable the drawing of an atom, uncheck the checkbox at the far left in the list.
Add/Update/Delete
Click the “Add” button to add a new atom, the “Update” button to replace one, and the “Delete” button to remove an existing atom. If you want to permanently save changes made here, be sure to also add or update them in the main window. Otherwise, when you change the selection in the crystal list of the main window, the changes made here will be lost.
Element Type and Atom Position Tab
Label
Enter the atom label.
Element
Display/set the element.
X, Y, Z
Display/set the fractional coordinates of the atom. Enter real numbers from 0 to 1 or fractions such as 1/2 or 2/3.
Occ
Specify the occupancy of the atom. Specify a real number from 0 to 1.
Origin Shift Tab
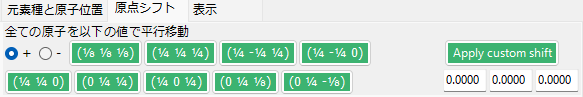
Performs a shift in atom position. Click a preset button or enter a Custom value and click the “Apply custom shift” button.
Display Tab
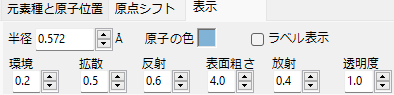
Set the radius, color, and texture of the atoms to be drawn.
Update Atoms of the Same Type
Appears only when this tab is selected. Applies the set information (ionic radius and drawing color) to all atoms of the same element type.
Radius/Atom Color
Specify the atomic radius or drawing color of the atom.
Ambient/Diffusion/Reflection/Roughness/Emission/Opacity
Set the texture of atoms when drawing. (Ambient: intensity of ambient light; Emission: intensity of emitted light; Shininess: intensity of reflected light; Diffusion: intensity of diffuse light; Specular: intensity of reflected light; Alpha: transparency)
3.3.3. Bonds and Polyhedra
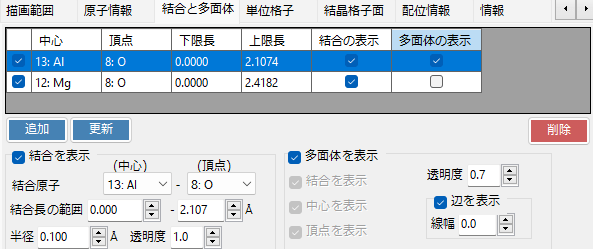
This tab inputs information about bonds and polyhedra that are used when drawing crystal structures.
Bond List
Bond information is displayed. To temporarily disable a bond, uncheck the checkbox at the far left of the list.
Add/Update/Delete
Click the “Add” button to add a new bond, the “Update” button to replace one, and the “Delete” button to remove an existing bond. If you want to permanently save changes made here, be sure to also add or update them in the main window. Otherwise, when you change the selection in the crystal list of the main window, the changes made here will be lost.
Display Bonds
Configure/display bond information.
Bond Atoms (Center/Vertex)
Display/set the element types that make up the bonds. When drawing polyhedra, the center and vertices are distinguished, so set them appropriately.
Bond Length Range
Display/set the lower and upper limits of the bond length. If it exceeds/falls below this threshold, it is not rendered.
Radius
Display/set the thickness (radius) of the bond to be drawn.
Opacity
Display/set the transparency of the bond to be drawn.
Display Polyhedra
When checked, the control becomes active and polyhedra composed of bonds are displayed (if a polyhedron can be formed).
Display Bonds
When checked, bonds within the polyhedron are displayed.
Display Center/Vertices
When checked, the center/vertex atoms of the polyhedron are displayed.
Opacity
Set the transparency of the polyhedron face.
Show Edges / Line Width
When checked, the edges (lines connecting vertices) of the polyhedron are displayed. When displayed, the line thickness can be adjusted.
3.3.4. Unit Cell
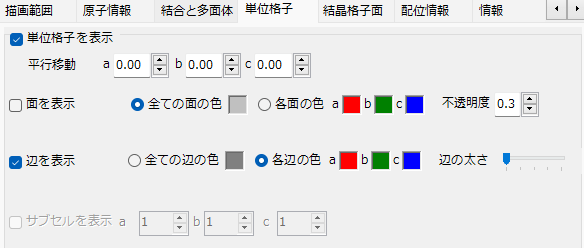
This tab configures the display of the unit cell of the crystal. When “Show unit cell” is checked, the control becomes active and the unit cell is drawn.
Translation
All space groups have a default origin. When you want to translate the center of the unit cell from the space group origin, set the translation amount in the a, b, c axis directions.
Show cell plane
Determines whether to draw the six planes that make up the unit cell. When drawn, set the color and transparency of that plane.
Show edges
Determines whether to draw the edges of the unit cell. When drawn, set the color of the edges.
3.3.5. Crystal Lattice Planes
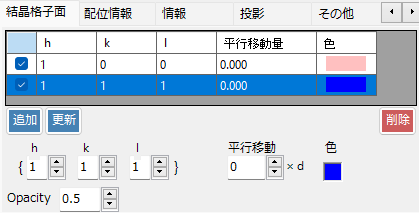
This tab configures the display of crystal planes. A list of crystal lattice planes is displayed at the top. To temporarily disable a crystal lattice plane, uncheck the checkbox at the far left of the list.
Add/Update/Delete
Click the “Add” button to add a new crystal lattice plane, the “Update” button to replace one, and the “Delete” button to remove an existing crystal lattice plane. If you want to permanently save changes made here, be sure to also add or update them in the main window. Otherwise, when you change the selection in the crystal list of the main window, the changes made here will be lost.
h k l
Specify the crystal lattice planes to be drawn using Miller indices.
Translation
If you want to translate the crystal planes, enter the translation amount.
3.3.6 Coordination Information
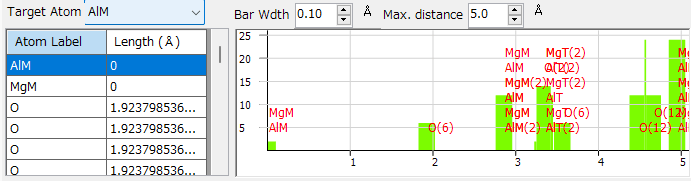
Information about the coordination distance of atoms is displayed.
Table (Left side)
The table on the left displays what kinds of atoms exist at what distances around the atom specified as the Target atom.
Graph (right side)
This is a graph of the information in the left table. By adjusting the “Bar width” to an appropriate thickness, the coordination number of the “Target atom” can be estimated.
3.3.7. Information
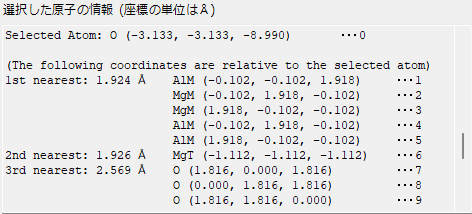
When you double-click an atom, the distance to nearby atoms and bond angles are displayed.
3.3.8. Projection
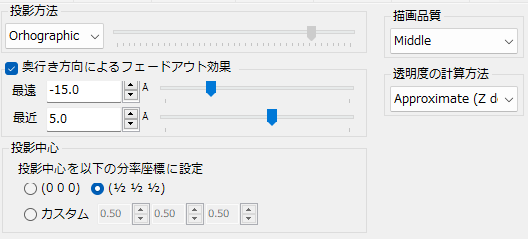
Configure the projection method, quality, and fade-out effect.
Projection Method
Set the projection method. “Orthographic” performs true parallel projection (infinite distance projection). “Perspective” performs perspective projection from the viewpoint distance set by the trackbar.
Fade-out Effect
Performs fade-out processing for objects rendered farther away in terms of screen depth. Objects farther than the value set by “Far” become completely transparent, while objects closer than the value set by “Near” are completely opaque. Objects in between are set to a transparency in the range 0-1.
Projection Center
Set where the projection center coincides in fractional coordinates.
Drawing Quality
Select the drawing quality. When increasing the quality, the drawing process becomes slower, so please select a quality that matches your GPU performance.
Transparency Calculation Method
Select the algorithm for calculating the overlap of semi-transparent objects (atoms and polyhedra). “Approximate” is fast but may result in inaccurate rendering depending on the arrangement of objects. “Perfect” calculates transparency correctly but becomes very slow, requiring an external GPU card.
3.3.9. Others
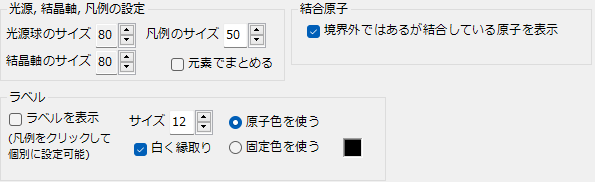
Light Source, Crystal Axes, and Legend Settings
Set the size of the Accessory control. Also, when you check “Group by element”, the legend is displayed by element rather than by label.
Label
Configure the display of atom labels. You can change the font size and color.
Bond Atoms
In “3.3.3. Bonds and Polyhedra”, if some interatomic bonds are set and those bonds cross the drawing boundary, atoms outside the boundary are still drawn.
7.4. Bottom Toolbar
From the toolbar located at the bottom, select the object to be drawn.
Crystal Axes
Displays the direction of the axes. The size of the axes reflects the lattice constants. Mouse rotation can also be performed in this box.
Lightning ball
Specifies the position (direction) of the light source. Can be changed by left drag.
Legend
Displays the legend of atoms. You can choose whether the displayed text uses the label or the element name from the Misc tab.
Like Vesta
Changes the atom colors/sizes and bond settings to have the same appearance as the well-known software Vesta.