1.0. Overview
Upon launching, the following screen appears. From this window, you can load profiles, display diffraction peaks, and perform indexing, fitting, and other operations. Loading profiles and crystals is also supported via drag and drop.
This window is broadly divided into the following sections:
- Profile Drawing Area
- File Menu (top)
- Tab Menu (upper area)
- Function List (upper area)
- Profile List (upper right)
- Crystal List (lower right)
Each section is described below.
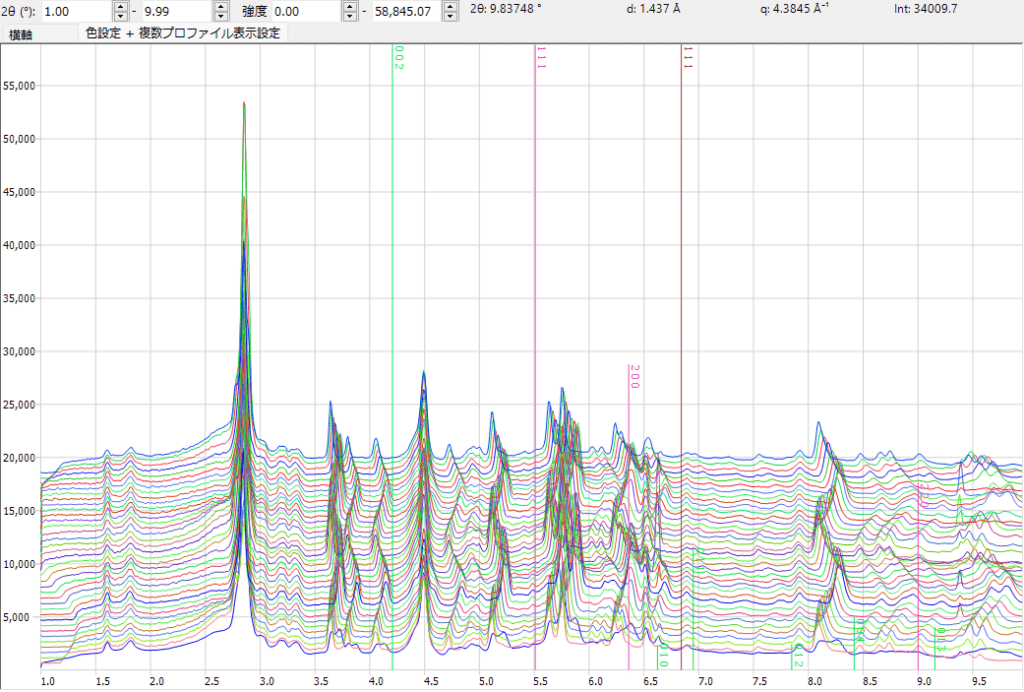
1.1. Profile Drawing Area
The profile drawing area occupies most of the Main Window. Profiles that are checked in the “Profile List” are displayed in this area. If a crystal is checked in “Crystal Information,” its diffraction peaks are also displayed.
1.1.1. Mouse Operations
The profile drawing area accepts the following mouse operations:
- Left drag: Move diffraction lines (change crystal lattice parameters)
- Right drag: Zoom in
- Right click: Zoom out
- Middle drag: Pan
Note that the leftmost mouse operation (moving diffraction lines) changes the lattice parameters of the crystal. That is, by “aligning” the diffraction lines calculated from the lattice parameters with the observed peak positions, you adjust the lattice parameters. For more details on lattice parameter change behavior, see the Diffraction Lines / Crystal Information page.
1.2. File Menu
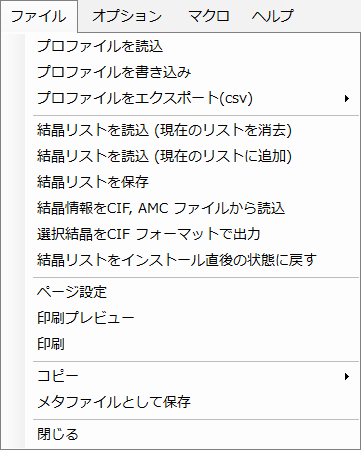
Load Profile
Loads profile data. In addition to the software’s native “pdi” format, it can read “csv” output from WinPIP, “chi” output from Fit2D, and similar formats. In general, any file stored in a text format of angle–intensity pairs can be loaded.
Save Profile
Saves profile data. The supported save format is the software’s native “pdi” format.
Export Profile (csv)
Exports the selected profile data in comma-separated (angle, intensity), tab-separated, or GSAS format.
Load Crystal List (clear current list)
Loads a crystal list file (xml extension). The current crystal list will be discarded.
Load Crystal List (add to current list)
Loads a crystal list file (xml extension). The loaded crystals will be added to the current crystal list.
Save Crystal List
Saves the current crystal list.
Reset Crystal List to Initial State
Resets the crystal list to its initial state. Please note that all current crystal information will be lost.
Copy
Copies the currently drawn profile to the clipboard as a metafile (a format that preserves vector and font information). By pasting it into PowerPoint or Word, you can modify line thickness, fonts, and other properties.
Save as Metafile
Saves the currently drawn profile as a metafile. The EMF (Enhanced Meta File) format is supported. The saved “*.emf” file can be loaded in PowerPoint or Word.
Close
Exits the program.
Monitor Clipboard
Monitors the clipboard and automatically imports data when profile data is sent from IPAnalyzer or crystal data is sent from CSManager.
Monitor File
Monitors a specified directory and automatically loads any readable profiles that are saved there.
Clear Registry
Deletes the registry entries. A software restart is required.
Auto-save Crystal List on Exit
Automatically saves the crystal list when the software exits. On the next startup, the crystal list from the previous session will be restored.
1.2.1. Help Menu
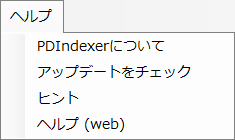
Check for Updates
Checks whether a new version has been released and performs the update if available.
Hint
Deprecated.
Help (PDF)
Displays this page.
Language
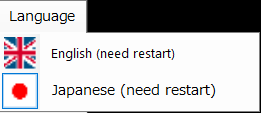
Switches the display language between Japanese and English. The software needs to be restarted for the change to take effect.
1.3. Tab Menu / Horizontal Axis Settings
In PDIndexer, all loaded profiles are converted to use the same horizontal axis, regardless of the incident X-ray source used for measurement. (The actual horizontal axis information can be changed from the “Profile Parameter” described later.) This means that even profiles measured with different X-ray sources can be compared with a unified horizontal axis. For example, a profile acquired with a Cu K line can be displayed as if it were acquired with the Mo K line wavelength.
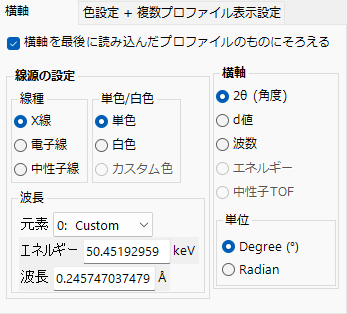
Align Horizontal Axis to Last Loaded Profile
When checked, the horizontal axis of previously loaded profiles is aligned to match the state of the newly loaded profile.
X-ray Source Settings
Sets the type of incident radiation source, whether monochromatic or white, and the wavelength or energy. If you are using a characteristic X-ray line (e.g., CuKα), the wavelength is set automatically.
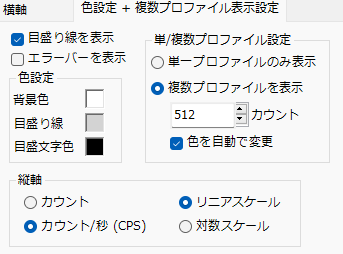
Show Grid Lines
Toggles the display of grid lines.
Show Error Bars
Toggles the display of error bars. This is only effective when the loaded profile contains error information.
Color Settings
Sets the display colors for the background, grid lines, and other elements.
Single/Multiple Profile Settings
Determines whether to display profile data in single or multiple profile mode. The currently active mode is indicated by a check mark.
Single Profile Mode
In this mode, only one profile is displayed at a time. In single mode, you cannot switch between profiles, so if you want to compare multiple profiles, use multiple profile mode.
Multiple Profile Mode
In this mode, multiple profiles can be displayed simultaneously. For multiple profile mode, further settings can be configured in the Profile Information page.
1.4. Profile List
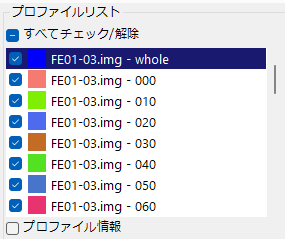
Displays and allows selection of loaded profiles. This is disabled in single profile mode.
In multiple profile mode, all loaded profiles are listed. Only the checked profiles are drawn in the central picture box.
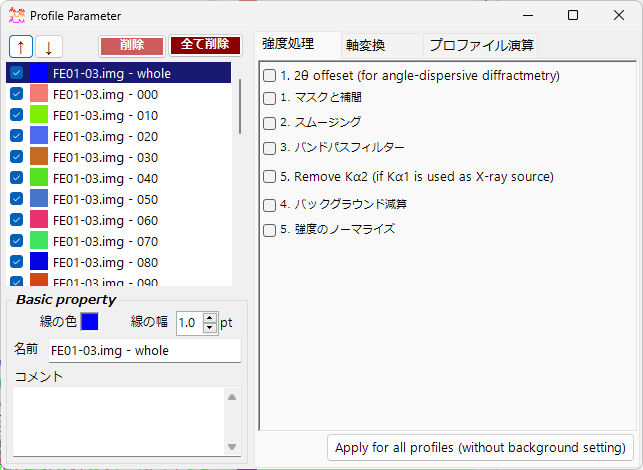
For more detailed profile settings, check the “Profile Information” checkbox at the bottom of the box. See the Profile Information page for details.
1.5. Crystal List
Displays and configures the crystal list. The initial state contains approximately 80 crystals. Checking a checkbox in the list displays diffraction lines at the corresponding peak positions.
At the top of this list, “Flexible Crystal” (with a light blue background) is pinned. When this crystal is checked, you can freely add diffraction lines and perform peak fitting.
Rows 2 through 10 (with a pink background) are crystals reserved for equation of state (EOS) calculations. See the Equation of State page for details.
For more detailed crystal settings and diffraction line display settings, check the “Diffraction Lines / Crystal Information” checkbox at the bottom of the box. See the separate page for details.
1.6. Function List
The function list at the bottom of the window provides quick access to the following sub-windows:
Profile Information
See here for details.
Equation of State
See here for details.
Peak Fitting
See here for details.