9.0. Overview
This tool detects spots in images containing diffraction patterns and performs indexing. It can directly read files captured with TEM cameras such as Digital Micrograph, and can also estimate specimen thickness when conditions are suitable.
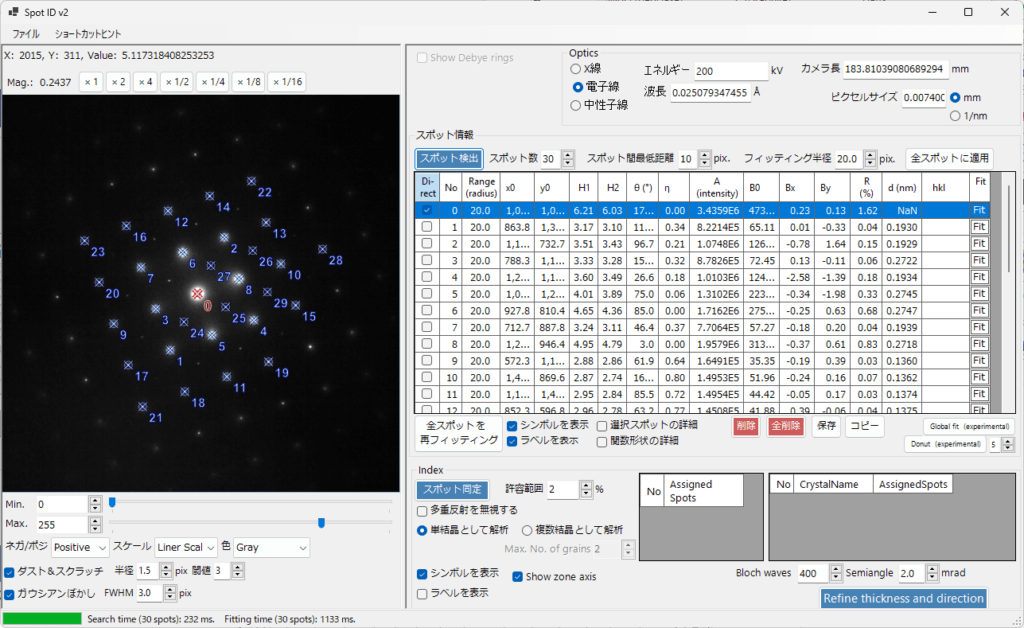
9.1. Image Display Area
This is the area where images are displayed. You can drag and drop an image file or load it from the File menu. Supports jpg, tif, dm3, and dm4 formats.
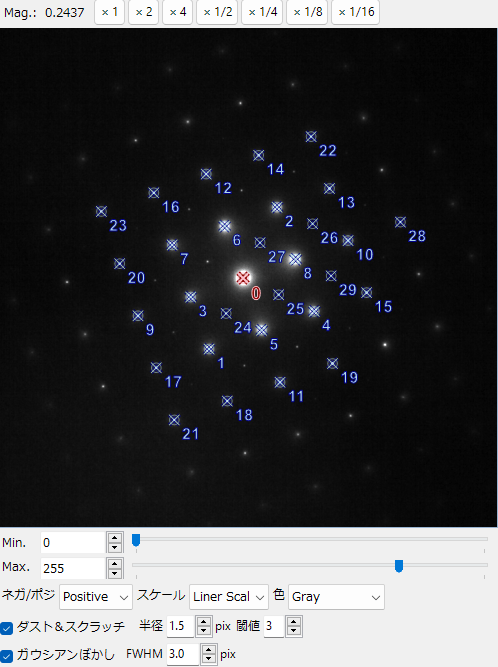
Mouse Operations
Right-click to zoom out, right-drag to zoom in. The following mouse operations are also supported.
- Left single-click: Spot selection
- Left double-click: Add spot
- Ctrl+left double-click: Add direct spot
- Ctrl+right single-click: Delete spot
Magnification Buttons (×1, ×2, …)
Magnifies or reduces the image to the specified magnification.
Min/Max
Sets the maximum and minimum brightness of the image. Can also be adjusted with the trackbar.
Negative/Positive
Select whether to display in Positive or Negative.
Scale
Select Linear scale or Log scale.
Color
Select one of Gray, Cold-Warm, Spectrum, or Fire.
Dust & Scratch
Removes bright spots in the image composed of one or several pixels. Specify the detection range for bright spots in pixel units, and set the detection threshold as a multiple of the standard deviation.
Gaussian blur
Applies a Gaussian filter (blur) to the image. The blur range is specified in pixel units.
9.2. Optics
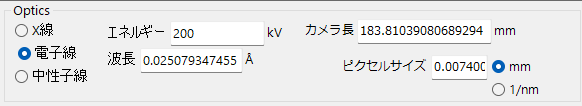
Input the incident source, energy/wavelength, camera length, and pixel size of the detector. If a *.dm3 or *.dm4 file is loaded, these values are automatically set using the information in the file.
9.3. Spot Information
Set the conditions for detecting and fitting spots, and the results are displayed in the table in the center.
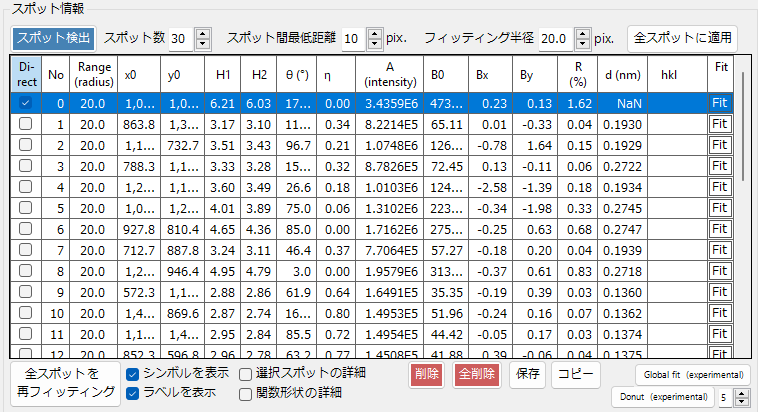
Upper Section
Spot Detection
After loading an image, pressing the “Spot Detection” button automatically detects diffraction spots in the image and fits them with a two-dimensional Pseudo-Voigt function1. The fitting results are displayed in the table.
Number of Spots
Sets the maximum number of spots to detect.
Minimum Distance Between Spots
Sets the minimum distance between detected spots.
Fitting Radius
Specifies the range for fitting detected spots with a two-dimensional Pseudo-Voigt function as a radius in pixel units.
Apply to All Spots
Resets the fitting range for spots in the table.
Central Section
The central section displays fitting results as a table. Cell contents can be edited by double-clicking.
Checking “Direct” at the far left of each row treats the checked spot as a direct spot. Clicking the “Fit” button at the far right of each row re-executes fitting for that spot only.
Lower Section
Refit All Spots
Re-executes fitting for all spots in the table.
Show Symbols/Show Labels
Select whether to display labels and symbols of detected spots overlapped on the image.
Details of Selected Spot
When checked, a separate window is displayed as follows.
In this window, the left side displays a magnified view of the selected spot, and the right side displays profiles in four directions. The blue line represents the image data, and the red line represents the fitting result.
Details of Function Shape
Displays the fitting function.
Delete/Delete All
Deletes the selected spot or all spots in the table.
Save/Copy
Saves table information in Excel format or copies it to the clipboard.
9.4. Index
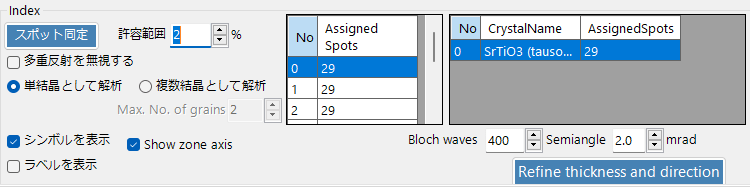
After spot detection has been performed, pressing the “Spot Identification” button performs indexing of the spots. The analysis targets the crystal selected in the main window.
Tolerance Range
Sets the acceptable error margin.
Ignore Multiple Reflections
When checked, analysis is performed ignoring multiple reflections.
Analyze as Single Crystal/Analyze as Multiple Crystals
Select whether to perform indexing as a single crystal or as multiple crystals. If the latter is selected, specify the maximum number of crystals to consider.
Show Symbols
Select whether to display labels and symbols of indexed spots overlapped on the image.
Refine thickness and direction
Using the Bloch wave method and considering dynamical diffraction effects, determines the specimen thickness and crystal orientation that best match the detected diffraction intensities.